It was coming, but only because markets have performed strongly since the November lows. We have seen breakouts in the () and , but both have drifted below their breakout levels. It wouldn’t take much to recover these losses, but buyers still have some heavy lifting to do.
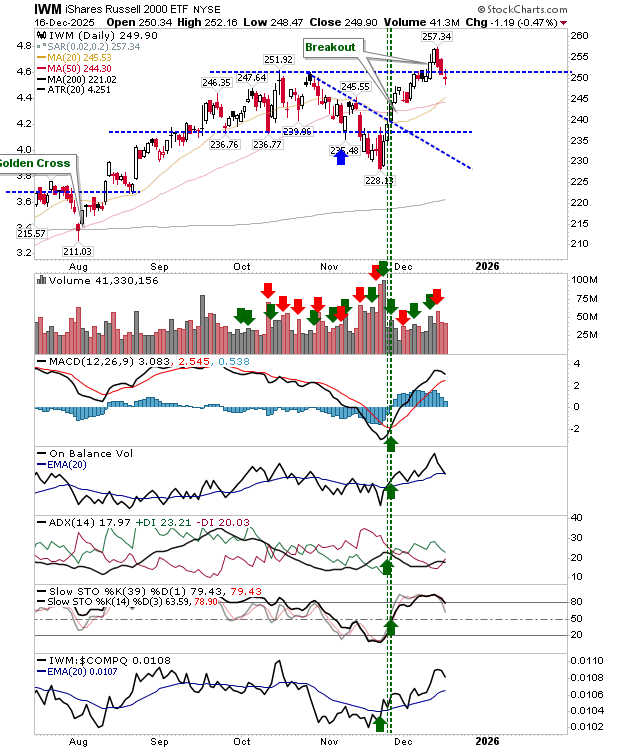
The Russell 2000 ($IWM) closed with an indecisive doji after two days of selling, but I would consider an indecisive doji at breakout support more bullish. Technicals are nest positive, but On-Balance-Volume is close to a ’sell’ trigger. However, the index is enjoying relative outperformance.

J.C. Parets has been tracking the equal weight S&P, and his newsletter has posted a more positive outlook on markets than I would have, but we need to consider all possibilities and the equal-weighted S&P has been a shining beacon. As with the Russell 2000 ($IWM), it’s not going to require much buying to get this back on a positive front.

The off-the-shelf is stuck in a trading range. No real damage either way despite the distribution on Tuesday. Given that, I have redrawn resistance from the October highs to mark the new trading range.
The , like the S&P, has been flying under the radar since coming off the October peak. Technicals are mixed and can go either way. Support and resistance converge in mid-January, but the next move should resolve in early 2026.
broked from the ’bear flag’, but a triple bottom, while rare, is still a possibility. Technicals don’t really shpport this (no bullish divergence), but let price be your lead.
have been taking this on the chin, but the action on Tuesday closed on converged 20-day and 50-day MAs with MACD, CCI and +DI/-DI on ’sell’ triggers. The doji on Tuesday was a marker for positive reversal after a few days of selling, but whether it can challenge 7,500 again is another thing.

For today, look for rallies across indices as the indecisive candlesticks stall the selling of the last few days.
5 Stocks Our Experts Predict Could Double In the Next Year
By submitting your email, you'll also get a free pivot & flow membership. A free daily market overview. You can unsubscribe at any time.