is pricing inflation. is not confirming growth. That divergence is where the risk is.
Freeport-McMoran (NYSE:) has fallen about 19% to 20% from its February 25 all-time high while closed above $112 per barrel on March 27, more than 50% above its level at the start of the conflict. That divergence matters because oil is pricing an shock, while copper is not confirming a parallel reacceleration in growth. The same macro shock that pushed energy prices higher has coincided with weakness in the metal that best reflects whether the economy can absorb that shock.
|
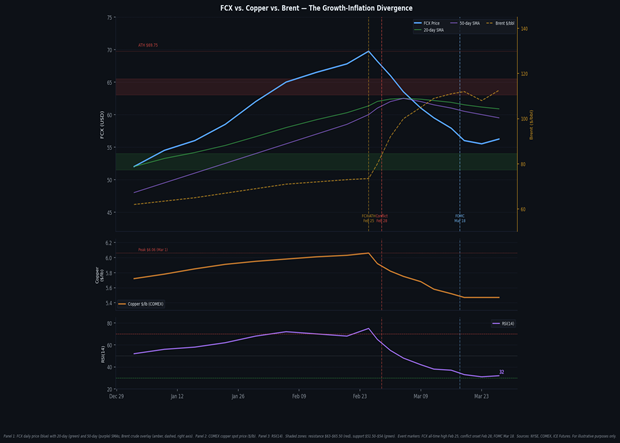
~$56 FCX PRICE Late Mar. 2026 |
$69.75 52-WK HIGH Feb 25, 2026 |
~19-20% FROM ATH Peak to current |
$5.47 COPPER $/LB COMEX, Mar 27 |
$112.57 BRENT CRUDE Close Mar 27, 2026 |
~32 RSI (14-DAY) Near oversold |
~22x fwd FCX FORWARD P/E ~37x trailing |
Mid-Late Apr NEXT EARNINGS Q1 2026 (est.) |
The Divergence That Matters
Since the U.S.-Israeli strikes on Iran in late February, Brent crude has stayed well above pre-conflict levels as the market priced a sustained supply risk premium tied to the disruption around the Strait of Hormuz. Brent closed at $112.57 per barrel on March 27, up more than 50% from the level at conflict onset. FCX has moved the other way. The stock peaked at $69.75 on February 25 and was near $56 by late March, while COMEX copper was around $5.47 per pound on March 27 after trading above $6 earlier in the month.
The divergence between oil and copper is the article’s central signal. Oil is behaving like an inflation asset during a live supply disruption. Copper is behaving like a growth asset whose demand still needs confirmation from real industrial activity. When oil rises while copper weakens, the market is not pricing a clean reflation cycle. It is pricing more inflation without a matching upgrade to growth. That combination does not resolve easily: copper weakness alone would be manageable. Copper weakness alongside an oil-driven inflation shock and a that cannot ease quickly is what turns the signal into a broader macro problem. Copper weakness does not prove recession. But copper weakness alongside elevated oil and a restrictive Fed is enough to challenge the market’s assumption that growth can remain intact while the inflation shock persists.
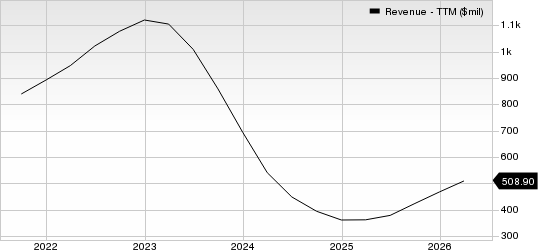
FCX is a cleaner equity expression of the copper signal than the broad indices. The company expects 2026 copper sales of approximately 3.4 billion pounds, or roughly 1.5 million metric tons equivalent, giving the stock direct leverage to copper prices. That does not make FCX a pure macro instrument, but it does make it a more transparent way to express the growth side of the oil-copper divergence than AI-adjacent equities or broad benchmarks where narrative and rate sensitivity obscure the signal.
Technical Snapshot
|
Metric |
Reading (Late March 2026) |
|
FCX last close |
Approximately $56 (late March 2026) |
|
52-week high |
$69.75 (February 25, 2026 — all-time high) |
|
52-week low |
$27.66 |
|
Decline from ATH |
Approximately 19% to 20% (peak to current) |
|
20-day SMA |
Approximately $60 — above price; short-term trend negative |
|
50-day SMA |
Approximately $59.50 — above price; bearish alignment confirmed |
|
200-day SMA |
Approximately $50 — structural long-term floor |
|
RSI (14-day) |
Approximately 32 — approaching oversold; selling pace, not reversal signal |
|
MACD (12,26,9) |
Negative; histogram narrowing — bearish momentum fading |
|
Key resistance |
$63–$65.50 (prior range ceiling); $59–$61 (20/50-day SMA cluster) |
|
Key support |
$52–$54 (structural support zone); $47–$49 (2025 accumulation zone) |
|
Copper (COMEX) |
$5.47/lb — down from $6.06 peak on March 1, 2026 |
|
Brent crude |
$112.57/bbl close March 27 — more than 50% above pre-conflict level |
|
Trailing P/E |
Approximately 37x |
|
Forward P/E |
Approximately 22x (source-dependent) |
|
Next earnings |
Mid-to-late April 2026 (company and market-calendar estimates vary) |
FIGURE 1

FCX — Daily Price, Copper Spot, and RSI(14) · January 2 through March 27, 2026. Panel 1: FCX price (blue) with 20-day (green) and 50-day (purple) SMAs; Brent crude overlay (amber, dashed, right axis). Shaded bands: resistance $63–$65.50 (red), support $52–$54 (green). Event markers: FCX all-time high February 25; conflict onset February 28; FOMC March 18. Panel 2: Copper COMEX spot price ($/lb). Panel 3: RSI(14). Sources: NYSE, COMEX, ICE Futures. For illustrative purposes only.
The price structure from the February 25 all-time high to the current close is a directional decline, not a consolidation. FCX set progressively lower highs and lower lows across four consecutive weeks following the conflict onset, a sequence that distinguishes trend deterioration from corrective noise. Both the 20-day and 50-day SMAs now sit above price and slope downward, confirming bearish alignment across the short-to-medium-term curve. An RSI reading near 32 does not constitute a recovery signal: it reflects that the pace of the decline has entered exhaustion territory, which historically precedes a deceleration in momentum rather than a directional reversal. The MACD histogram’s narrowing bars confirm that deceleration is underway. The $52 to $54 structural support zone is the reference that separates a cyclical correction from a deeper breakdown. At current copper prices and oil levels, the macro environment has not changed, and the technical structure will not resolve independently of it.
Why Copper Is Not Responding to the Oil Shock
The standard expectation when oil rises sharply is that industrial metals follow, either from reflation optimism or from the physical reality that energy inputs into mining become more expensive at the same time metal demand is presumed to increase. Neither channel has operated in the current episode. Copper has declined from its March 1 peak of $6.06 per pound to approximately $5.47 per pound on March 27, a drop of approximately 10% in four weeks, while Brent held above $100 per barrel through the same period.
The reason is that this oil shock is supply-disruption-driven, not demand-growth-driven. The Strait of Hormuz disruption removed supply from the market without adding a single unit of industrial activity. Oil prices rose because barrels cannot move; copper demand did not accelerate because no factory opened, no grid was extended, and no data center was built as a consequence of the conflict. The inflationary signal from oil is real and is flowing through to CPI expectations and Federal Reserve policy pricing. The growth signal that would normally validate rising copper prices is absent.
Copper had support earlier in the year from structural electrification expectations and energy-transition demand assumptions, but the macro backdrop shifted as oil rose and the rate environment hardened. In that setting, copper no longer had enough growth confirmation to sustain the premium it had been carrying. Goldman Sachs estimated the global copper market recorded a 600-kilotonne surplus in 2025, which provides context for why price support has been less durable than many expected.
The market is trading as if inflation is rising and growth is intact. Copper suggests that second assumption may be wrong.
The Fed Constraint and Its Equity Implications
The oil-copper divergence matters most through its effect on Federal Reserve policy. The March 18 Summary of Economic Projections showed a median 2026 forecast of 2.7%, with the median policy path implying only one rate cut in 2026 and seven of nineteen participants projecting no cuts at all. That is consistent with a Fed that remains cautious about easing into an energy-driven inflation shock even if growth-sensitive assets are losing momentum. Cutting rates into a sustained oil shock risks unanchoring price expectations. Holding rates while copper signals growth deceleration risks compounding the slowdown. Neither dataset resolves the dilemma cleanly.
The equity implication runs through discount rates and earnings simultaneously. Technology names and AI-adjacent equities are long-duration assets whose present value is directly sensitive to rate assumptions. FCX is a different kind of rate-sensitive asset: its earnings move with copper prices, which move with industrial activity, which moves with growth expectations. When FCX declines into a rising oil environment while energy-exposed names hold, the market is not simply rotating sectors. It is expressing the view that the economy cannot grow fast enough to absorb the inflation being priced into oil. That expression carries implications for the earnings assumptions embedded in broader index valuations.
Valuation still matters here. FCX does not look cheap if copper weakens further before demand reaccelerates. Depending on the source, the stock trades at roughly 37 times trailing earnings and approximately 22 times forward earnings. That is not extreme for a company with long-duration electrification exposure, but it does mean the stock is exposed if the market has to mark down near-term copper demand while the rate backdrop stays restrictive. FCX’s own 2026 guidance calls for approximately 3.4 billion pounds of copper sales at average unit net cash costs of $1.75 per pound. If realised copper prices weaken while energy costs stay elevated, that squeeze will appear first in margins.
Scenarios
|
Scenario |
Trigger Conditions |
Directional Bias |
|
Bearish |
Copper falls below $5.20/lb as Chinese demand data disappoints. Brent holds above $100/bbl. FCX Q1 earnings reveal margin pressure from higher energy inputs or weaker realised copper pricing. |
FCX faces downward pressure toward the $52 to $54 structural support zone. A sustained close below $54 on above-average volume would open the $47 to $49 accumulation zone from 2025. |
|
Base Case |
Copper holds $5.40 to $5.60/lb. Hormuz traffic partially recovers. Brent moderates toward $95 to $105/bbl. FCX Q1 earnings come in broadly in line with expectations. No change in Grasberg guidance. |
FCX consolidates in the $53 to $59 range. The stock absorbs the macro headwind without a directional break. This is the default scenario given RSI near 32 and copper stabilisation. |
|
Bullish |
Hormuz resumes near-normal traffic; Brent retraces below $90/bbl. Copper recovers above $5.70/lb on evidence that Chinese industrial demand is re-accelerating. Fed June cut probability rises above 50%. |
FCX recovers toward the $63 to $65.50 resistance zone as the growth signal from copper re-aligns with the inflation signal from oil. A close above $65 on volume indicates the divergence has resolved. |
What to Watch
The first variable to watch is whether Brent stays elevated or begins to lose its war premium. Reuters reported Brent at $112.57 on March 27 and at $115.77 on March 29 — still well above the pre-conflict level. If oil remains high while copper does not recover, the market will keep facing the same inflation-without-growth tension that has pressured FCX since late February. A durable reduction in Brent below $95 per barrel would require either a resumption of Hormuz traffic toward normal levels or a meaningful demand destruction signal from the global economy. Neither is visible in current data.
The second variable is inflation data. The March 18 SEP raised the median 2026 PCE forecast to 2.7%, reinforcing the view that the Fed is unlikely to ease aggressively into an energy shock. The April 10 CPI release will be the first print to fully capture Hormuz-driven energy pass-through from the conflict; the February reading covered a pre-conflict reference period and came in at 2.4% year-over-year. If that April print lands above 2.7%, the rate-cut path extends further, and the discount rate environment that has been suppressing growth-sensitive cyclicals remains in place.
The third variable is the copper price itself. A recovery above $5.70 per pound would indicate that industrial demand is beginning to reassert the structural growth narrative. A break below $5.20 per pound would indicate that demand destruction from the macro headwinds is outweighing the electrification and AI infrastructure case that had supported copper through early 2026. That range, $5.20 to $5.70, is where the oil-copper divergence resolves or confirms itself as a sustained macro imbalance. FCX’s earnings in mid-to-late April will be the first direct read on how the divergence is showing up in the company’s realised margins and cash flow.
Disclaimer: This article is for informational and analytical purposes only and does not constitute investment advice or a solicitation to buy or sell any security. Price data sourced from NYSE, COMEX, ICE Futures, MacroTrends, Reuters, Investing.com, CNBC, and publicly available analyst research. FCX price approximately $56, late March 2026. Copper COMEX $5.47/lb as of March 27, 2026. Brent crude $112.57/bbl close March 27, 2026. All prices approximate and subject to intraday change. FCX 2026 copper sales guidance of approximately 3.4 billion pounds per company disclosure. Goldman Sachs 2025 copper surplus estimate of 600 kilotonnes per publicly available research. Past price dynamics do not predict future behavior. Always consult a licensed financial advisor before making investment decisions.
5 Stocks Our Experts Predict Could Double In the Next Year
By submitting your email, you'll also get a free pivot & flow membership. A free daily market overview. You can unsubscribe at any time.