Calibrating the leverage of Cannabis corporations has always been a conundrum. The customary Debt/EBITDA metric serves its function, but Viridian posits that Total Liabilities / Market Cap offers a more refined valuation, reflecting the asset worth over debts instantaneously, impervious to financial shenanigans or market shifts.
The Unconventional Metrics
For those investors preferring a numbers-based viewpoint, Viridian champions the Viridian Capital Credit Tracker model, incorporating a fresh gauge guided by fundamental principles:
Leases, a considerable portion of many cannabis firms’ capital, must be equated to debts, constituting a substantial fraction of the collective debt and leases at notable entities like Planet 13, 4Front, Green Thumb, Ascend, and Curaleaf. These long-standing obligations, often linked to vital facilities, harbor cross-default clauses, posing a significant risk. Though lease defaults can’t trigger bankruptcy formally, cannabis entities enjoy scant bankruptcy safeguards.
Cannabis companies grapple with tax repayment defaults, effectively borrowing from the government, often at more favorable rates than available in commercial markets. Viridian accounts for tax liabilities exceeding one-quarter of the tax expense as debts, regardless of how the enterprise categorizes these dues.
The Adjusted Calculations
Viridian tweaks the total debt by factoring in leases and excess taxes before deducting cash, yielding a revised net debt assessment. As lease payments shrink EBITDA, including these figures as debts necessitates adjusting EBITDA correspondingly. Viridian augments lease expenses to EBITDA to derive EBITDAR. Given analysts’ non-inclusion of forward lease charges in projections, the most recent quarterly rent is annualized in the estimates.
Isn’t it logical to fine-tune the standard EV/EBITDA valuation benchmark?
Absolute, yet Viridian goes the extra mile, amalgamating these conventional ratios into its valuation framework, advocating for a more discerning measure. By summing the adjusted net debt with market cap, Enterprise value is computed. EBITDA serves as the denominator in the EV/EBITDAR ratio, enriching the valuation perspective.
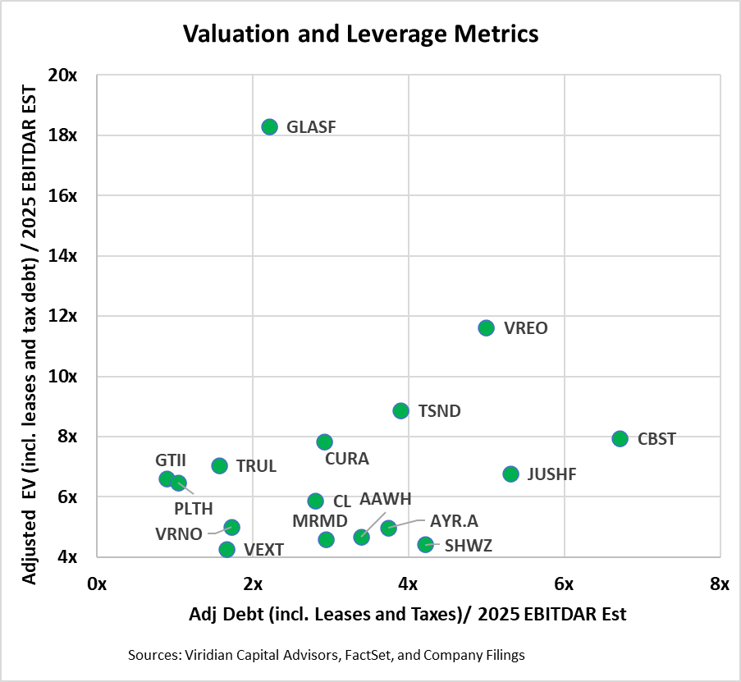
A Practical Application: The Graph
The graph showcases the foundation values for the fresh leverage and valuation metrics. The inclusion of leases and taxes invariably elevates these metrics. The forthcoming tracker will delve into the relative consequences on both leverage and valuation, reflecting a more authentic financial portrayal.
The Viridian Capital Chart of the Week spotlights pivotal investment, valuation, and M&A trends derived from the Viridian Cannabis Deal Tracker.
-
Indicators by Industry Sector
-
Deal Structure and Company Status
-
Key Principals and Terms
-
Capital Flow by Location
-
Credit Ratings Insights
Since its establishment in 2015, the Viridian Cannabis Deal Tracker meticulously logged over 2,500 capital raises and 1,000 M&A deals, totaling a staggering $50 billion.
The foregoing discourse is sourced from an external contributor and does not mirror Benzinga’s stance, remaining unaltered.
5 Stocks Our Experts Predict Could Double In the Next Year
By submitting your email, you'll also get a free pivot & flow membership. A free daily market overview. You can unsubscribe at any time.