- Bullish market signal – Breadth Thrusts
- Short-term market indexes are overbought and at resistance
- Most economists expected a recession in 2023. It didn’t happen
- The economy is still a risk factor in 2024. A recession, if it occurs, would push stocks much lower.
No market indicator is infallible. Therefore, I utilize a weight-of-the-evidence approach to formulating my market thesis.
Based on this approach, the market appears to be longer-term bullish; however, major market indexes are overbought and at major resistance. Hence, we might witness near-term market weakness that allows stocks to work off their overbought condition before making another run higher.
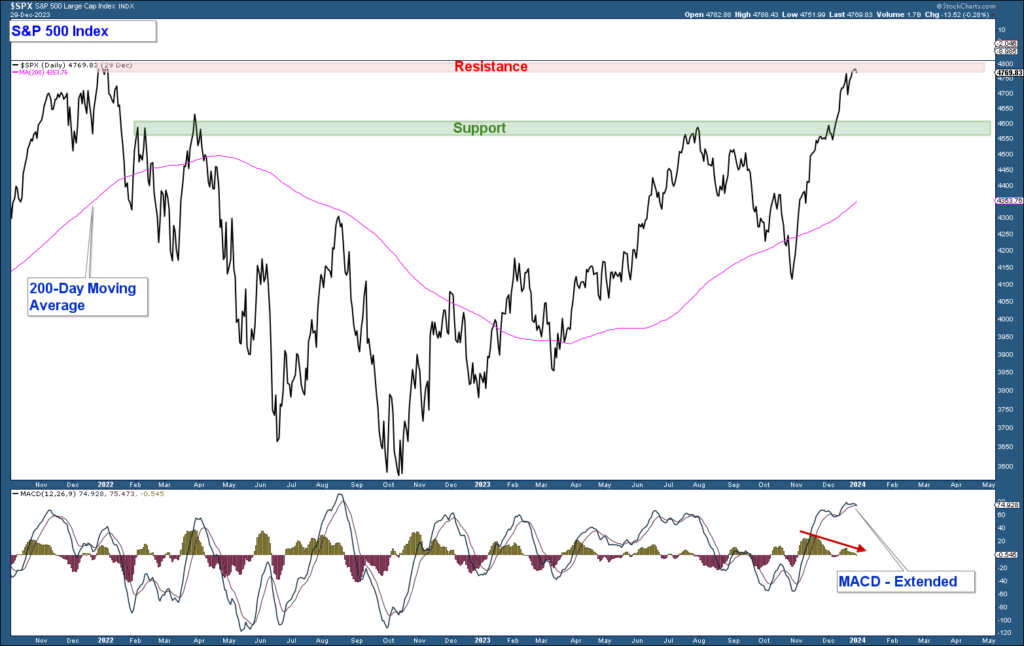
Below is a chart of the in the upper panel and its MACD (a momentum indicator) in the lower panel. Here are my takeaways.
- The index advanced strongly over the past two months without a pullback. This type of advance, while bullish, is not sustainable. From a price action perspective, the market is due for a pullback. Given that the bulk of the longer-term technical data is positive, any pullback is likely to be a buying opportunity and not a major market top.
- The MACD is at the top of its range and is close to rolling over, indicating that momentum is waning and the odds of a consolidation or pullback are elevated.
- The index has reached an important resistance area, the January 2022 high. The combination of momentum waning and the index sitting at major resistance, suggests elevated odds of a short-term pullback.
- If the market does pull back and market technicals remain positive, I expect the index to not drop decisively below support (highlighted in green) or its 200-day moving average.

Breadth Thrust – Zweig
The market’s recent (November – December) advance was strong and broad-based, leading to numerous breadth indicators displaying a long-term bullish signal called a breadth thrust.
In bearish market environments, stocks become substantially oversold, and their advances are comparatively weak. This trend defines bearish market environments where the long-term trend is down.
When the broader stock market makes a strong move lower (within a bearish market environment) and subsequently advances strongly within a short period, it is termed a breadth thrust. This strong move higher runs counter to the previous weaker counter trend moves higher and signals the start of a new bull market.
Various breadth indicators can measure this phenomenon. One of the most popular is the Breadth Thrust Indicator (displayed in the chart below), commonly known as the Zweig Breadth Indicator. This indicator is based on the percentage of advancing stocks on the NYSE.
When the Breadth Thrust Indicator drops below .40 (red line), then rises above .615 (green line) within 10 days, it signals a breadth thrust. This commonly watched indicator fired off a signal at the beginning of November 2023 (highlighted in green). Two previous moves (highlighted in blue) advanced from below the red line and then rose above the green line; however, they did not occur within 10 trading days and thus were not valid signals.
Investopedia:
“The Breadth Thrust Indicator is sometimes known as the Zweig Breadth Indicator, after its creator. According to Zweig, there have only been 14 Breadth Thrusts since 1945. The average gain following each of these thrusts was 24.6% in an average time-frame of 11 months. Zweig furthermore highlights the fact that the majority of bull markets begin with a Breadth Thrust.”

Risk-On/Off & Market Breadth
The following is the same chart I shared in last month’s newsletter.
In the top panel is a chart of the S&P 500 Index. The second panel displays a market breadth indicator that measures the percentage of stocks hitting new 52-week highs minus those hitting 52-week lows. The bottom three panels are relative strength charts aiding in the determination of a bullish, risk-on market environment. Here are my takeaways from the chart.
- In the second panel (S&P 500 New Highs-New Lows Percent), an ascending line signifies an expansion in the number of stocks hitting new highs, indicating healthy market breadth when the line is above its moving average, as it is now.
- The three bottom charts are relative strength charts. They compare the performance of , , and stocks (risk-on indexes) to a risk-off sector. When the line falls, it indicates that the risk-on asset is underperforming and when it rises, those risk-on indexes are outperforming. All three have risen above an area of consolidation, suggesting a bullish, risk-on environment.
Conclusion: Stock market breadth is positive, and risk-on securities are outperforming more conservative risk-off securities, reflecting investors’ willingness to take on risk. Market breadth and sentiment are bullish.

Conclusion
Longer-term market technicals are decidedly bullish. Market Breadth is positive, the market is in a risk-on environment, interest rates are declining, and the recession that most economists predicted for 2023 didn’t occur. At least, not yet.
Short-term the market is overbought and sitting at major resistance. The market is due for a breather which could result in market indexes pulling back or consolidating before making another push higher.
While the majority of the technical data is market-positive, if the economy slips into recession this year, stocks are going to fall hard.