Key market indicators for November 2024 present a complex but opportunity-filled environment for traders and investors. Following the first phase of Federal Reserve rate cuts and growing global uncertainties, the technical landscape suggests several notable shifts. Let’s explore the key market indicators to watch.
Seasonality and Breakout Patterns
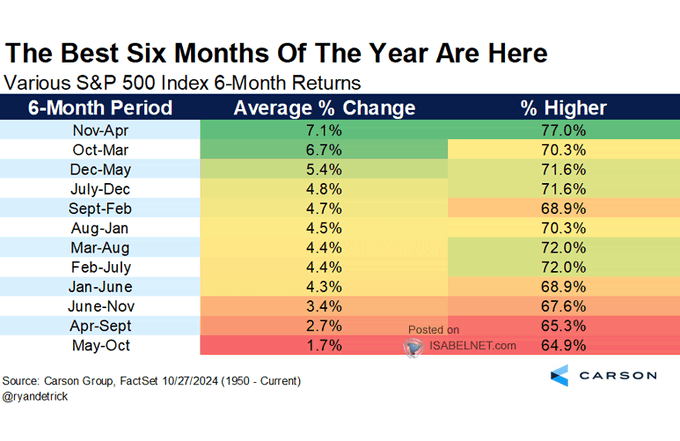
As discussed recently, key market trend in November. Historically, the stock market transitions from the weaker summer months into a stronger end-of-year rally, often dubbed the “Santa Claus Rally,” beginning mid-December. On a rolling 6-month basis, November to April has both the highest percentage returns and the highest hit rate at 77%.

The seasonal trend is reinforced by the weekly MACD (Moving Average Convergence Divergence) signal crossing into bullish territory, hinting at upward momentum through the year-end. The previous two seasonal “buy signals” have worked well for investors. However, that signal does not preclude a short-term correction to moving average support levels.
As noted in that previous article, the return of corporate share buybacks will be an important support to the market, adding nearly $6 billion daily to large-cap purchases.
Sectors to Watch: Tech and Industrials Lead
With interest rates declining, cyclical sectors—like and —are gaining strength. Large-cap tech companies, particularly the “Magnificent 7,” are all holding above critical moving averages. Despite more bearish investors suggesting the “AI” trade is done, the price action continues to suggest strong institutional participation, which could drive the higher into year-end.
Such is particularly the case given that hedge funds remain significantly underweight U.S. equities versus the benchmark. On a risk-adjusted return basis, we are already seeing them increase exposure to “catch up” on performance into year-end.
Notably, these stocks generate all estimated earnings growth for the .

Meanwhile, the industrial and sectors, which were consolidating from March to August, are beginning to trend higher. Such is due to expectations of a Presidential election outcome that would lead to stronger economic growth, and investments, tax cuts, and reshoring of U.S. manufacturing.
Those policies would also generate stronger domestic employment, higher wage growth, larger investments in technology, and increased loan demand from the financial sector. This is likely why we have also seen improvement in those sectors lately.

Back to seasonality, it is also notable that many of the stocks that drive the and sectors are also some of the largest purchasers of their shares. As that window opens into year-end, additional price support should be provided.
Volatility Rising
Of course, while the market may be betting on a certain election outcome, over the last month, the rise in the Volatility Index () signals potential unease beneath the surface. Typically, VIX declines as equities rise, reflecting lower risk sentiment. However, the current divergence suggests investors continue to hedge against an unanticipated or contested election outcome.
The chart shows the $VIX index inverted against the S&P 500 index. Normally, there is a high correlation between the inverted volatility index and the market. However, the non-correlation is currently extremely elevated, suggesting professionals are hedging their portfolios against downside risk.

While not an immediate red flag, this disconnect warrants caution. Investors should monitor for potential market reversals or volatility spikes, as rising VIX amid bullish markets can indicate heightened sensitivity to external shocks. However, if the election passes as anticipated, the reversal of volatility hedges could also provide an additional tailwind for equities into year-end.
The key point for investors is to be aware of short-term risks in the market despite a stronger bullish view into year-end. Therefore, continue to adjust strategies to incorporate volatility-based stops or other hedges to manage risks effectively.
Momentum Indicators: Negative Divergences
The Relative Strength Index (RSI) and the Moving Average Convergence Divergence (MACD) indicator offer mixed signals on the broad market. While the broad market remains bullish, holding above key moving averages, relative strength and momentum show a negative divergence.

These negative divergences have often preceded short to intermediate-term corrective market actions. At this point, investors tend to make two mistakes. The first is overreacting to these technical signals, thinking a more severe correction is coming. The second is taking action too soon.
Yes, these signals often precede corrections, but there are also periods of consolidation when the market trades sideways. Secondly, reversals of overbought conditions tend to be shallow in a momentum-driven bullish market. These corrections often find support at the 20 and 50-day moving averages (DMA), but the 100 and 200-DMAs are not outside regular corrective periods.
Navigating Market Uncertainty and Upcoming Catalysts
The November outlook marks a critical period with macroeconomic and election uncertainties still in play. The Fed’s dovish tone remains encouraging for equity markets, but geopolitical risks and U.S. election developments could inject volatility. As we approach the year-end, investors must remain agile and ready to respond to sudden market shifts. Therefore, investors may want to consider several strategies:
- Increase Equity Exposure: Large-cap stocks historically perform well during this period. You could consider increasing exposure to diversified index funds or sector ETFs that align with historical trends. If you are a stock picker, focus on large-cap, highly liquid names that generate the strongest earnings growth.
- Review Portfolio Risk: While the MACD buy signal is a positive indicator, you should assess your portfolio’s risk tolerance and ensure it aligns with your long-term goals.
- Rebalance Allocations: Now may be a good time to rebalance by reducing positions in riskier assets or diversifying across asset classes.
- Use Stop-Loss Orders: To manage downside risk, consider using stop-loss orders.
While the markets remain very bullish currently, rebalancing risk may lead to short-term underperformance while the “sun is shining.” However, a steady practice of risk controls ensures you won’t be caught without an umbrella which it “begins to rain.”
“The trick to navigating markets is not trying to “time” the market to sell exactly at the top. That is impossible. Successful long-term management is understanding when “enough is enough” and being willing to take profits and protect your gains. For many stocks currently, that is the situation we are in.” – TheBullBearReport
As we head into the Mega-cap earnings reports, that advice remains relevant this week. The trick will be to navigate the outcome without making emotionally driven decisions.
Continue to follow the rules and stick to your discipline. (Read our article on “” for a complete list of rules)
Note: If you are unfamiliar with basic technical analysis, this video is a short tutorial.


