Earnings season is winding down, but a few big players are still set to deliver their quarterly reports this week. Among them are Crowdstrike (CRWD), Lululemon (LULU), Dollar Tree (DLTR), and Docusign (DOCU).
Before a company unveils its earnings, implied volatility tends to soar as the market grapples with uncertainty. This heightened volatility is driven by speculators and hedgers flooding the options market, pushing up prices.
Post-earnings, implied volatility typically retreats to baseline levels.
Exploring the anticipated range for these stocks involves summing the price of the at-the-money put option and call option from the option chain. This calculation leverages the expiry date following the earnings announcement. While not as precise as detailed computations, this method offers a solid estimate.
Tuesday
HPE – 11.3%
CRWD – 11.0%
Wednesday
LULU – 10.0%
DLTR – 9.9%
Thursday
DOCU – 9.6%
Friday
Nothing of note
Options traders can leverage these projected moves when structuring trades. Bearish traders might consider selling bear call spreads beyond the expected range.
Bullish traders could sell bull put spreads outside the anticipated range, or explore naked puts for those comfortable with higher risks.
Neutral traders may find iron condors appealing. For earnings-driven iron condor trades, maintaining short strikes outside the expected range is advised.
Opting for risk-defined strategies and limiting position size is crucial when engaging in options trading around earnings. In the event of an unexpectedly large stock movement resulting in full losses, the impact on the portfolio should not exceed 1-3%.
Stocks With High Implied Volatility
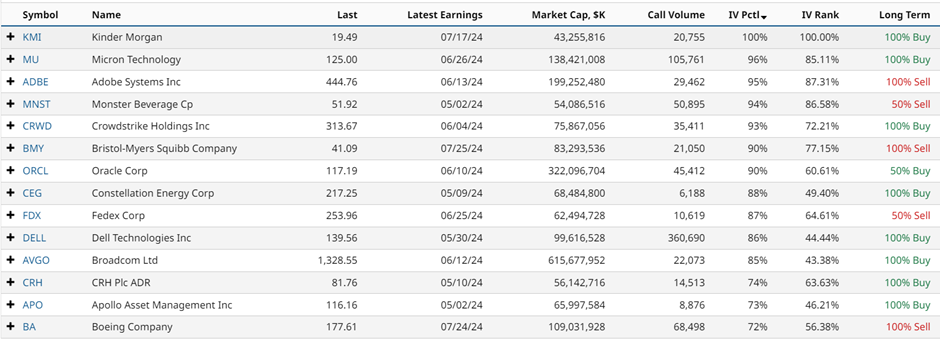
By utilizing Barchart’s Stock Screener, high implied volatility stocks can be identified.
Applying filters such as total call volume above 5,000, market cap over $40 billion, and an IV Percentile surpassing 70% generates a list sorted by IV Percentile. Several stocks exhibit elevated volatility, primarily due to earnings.

You may refer to an article for insights on finding option trades during this earnings season.
Last Week’s Earnings Moves
Last week’s actual versus expected movements are compared below. Several stocks, including CRM, DELL, MDB, MRVL, and PATH, experienced notable downward trends.
FUTU +3.0% vs 7.8% expected
CRM -19.7% vs 6.8% expected
PATH -34.0% vs 13.2% expected
DELL -17.9% vs 11.0% expected
MRVL -10.5% vs 8.4% expected
COST -0.7% vs 4.3% expected
BURL +17.6% vs 9.1% expected
ZS +8.5% vs 10.5% expected
DG -8.1% vs 9.1% expected
BBY +13.4% vs 5.9% expected
MDB -23.9% vs 11.6% expected
ULTA +2.5% vs 7.1% expected
Out of 12 cases, five stocks remained within the anticipated range.
Unusual Options Activity
MGM, DELL, AMZN, RIVN, MSFT, NVDA, SQ, and MRVL caught attention with unusual options activity last week.
Additional stocks displaying unusual options activity are detailed.

Remember, options carry risks, with potential for 100% loss. This article serves educational purposes and not trading advice. Always conduct due diligence and consult a financial advisor before investment decisions.


