Amazon.com Inc AMZN emerges as a standout performer as robust consumer spending data uplifted AMZN stock. Retail sales soared 1% on a monthly basis in July, surpassing economists’ expectations of a 0.3% rise.
Year-over-year, retail sales surged 2.7%, a notable improvement from a revised 2% in June. In addition, initial jobless claims dropped to a five-week low at 227,000, easing concerns over labor market conditions.
This positive development provides relief amid Amazon’s recent disappointment from a mixed second-quarter earnings report. Despite falling short on net sales and issuing soft guidance, the retail data has injected newfound optimism into the market.
The economic landscape, plagued by inflation concerns earlier this year, has left both bulls and bears with reasons to consider their positions on AMZN stock.
Direxion’s AMZN-Focused ETFs: To cater to investors’ sentiments on Amazon, Direxion offers two focused exchange-traded funds. For optimists, the Direxion Daily AMZN Bull 2X Shares AMZU aims for double the daily return of AMZN. On the contrary, the Direxion Daily AMZN Bear 1X Shares AMZD provides the inverse daily return.
For both AMZU and AMZD, it’s crucial to note that these funds are designed for short-term holding, not long-term investment, due to the daily compounding effect.
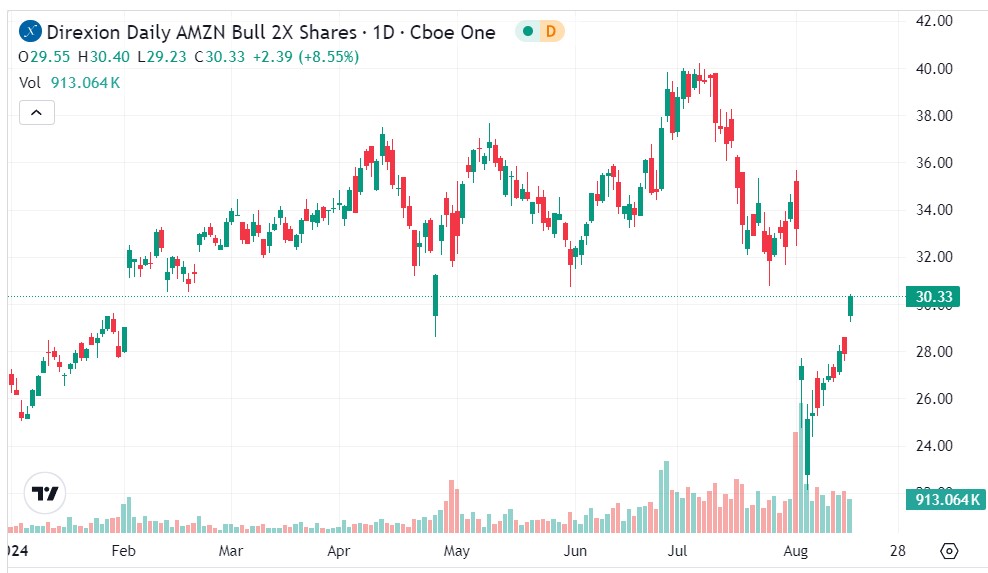
The AMZU ETF: Despite a rocky path following Amazon’s Q2 earnings, the positive retail sales report lifted AMZU, breaching key moving averages and aiming for further levels of resistance.
- AMZU surpassed the 20-day exponential moving average and eyes the 200-day moving average.
- The $32 support line remains critical for potential upside movements.
The AMZD ETF: Prior to Amazon’s Q2 report, AMZD struggled, slipping below important moving averages. However, the bearish sentiment is now being challenged post the retail data release.
- AMZD fell below its 200-day moving average and the 20-day exponential moving average.
- The 50-day moving average presents a crucial support level to watch for further bearish movements.