Exploring September’s Historical Volatility
Looking back at historical data, the month of September typically comes with its fair share of turbulence. Over the past 95 years, while the S&P has experienced gains in September 42 times, the remaining 53 losing years have shown an average decline of 4.7%.
The recent three Septembers have been particularly turbulent:
- 2021: -4.8%
- 2022: -9.3%
- 2023: -4.9%
Though this trend might signal impending volatility, historical patterns indicate that November and December often bring significant market upswings following a rocky September, suggesting a cautious yet optimistic outlook.
Navigating Potential Root Causes Behind Volatility
As we delve deeper, it becomes evident that the current market climate poses challenges beyond seasonal patterns.
While historical data aligns with potential September pullbacks, the present economic landscape deviates from the norm, pushing indicators and market characteristics to record highs, hinting at underlying instability.
Should stocks descend, distinguishing between typical seasonal weakness and a more ominous downturn presents a predicament.
Before addressing this conundrum, let’s examine the prevailing “instability” to gain clarity on our current positioning.
Approaching Record-High Household Stock Allocations
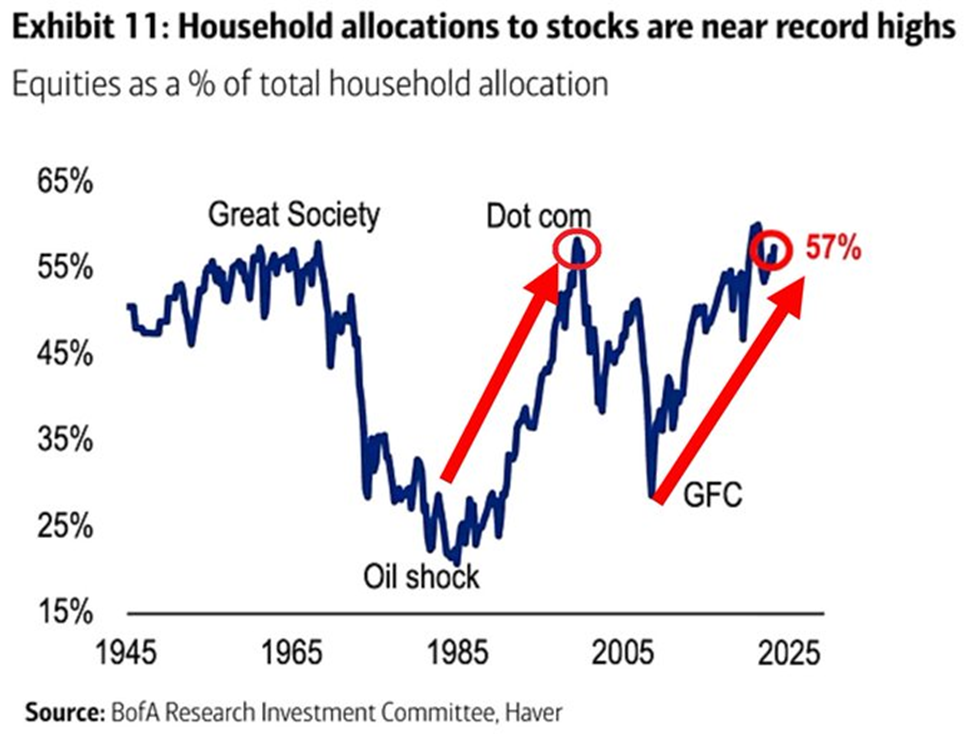
A sharp rise in US household allocations to stocks, reaching 57%, nearing an all-time high, has raised concerns. This surge, doubling in around 15 years, echoes warnings observed during the 2000 Dot-Com Bubble Peak.
History suggests that such extensive stock ownership often acts as a precursor to diminished buying power, potentially impeding further market escalation.
As highlighted by Stéphane Renevier from Finimize, long-term stock returns are heavily influenced by the proportion of assets channeled into stocks, indicating potentially subdued future returns amidst escalating stock ownership.
Navigating Unprecedented Market Concentration
Recent data reveals a striking market concentration, with the technology, telecom, and healthcare sectors dominating global stocks at a record-setting 45%, surpassing levels witnessed during the Dot-Com bubble peak in 2000.
In contrast, the financial, energy, and materials sectors’ weight has dwindled to 25%, mirroring figures from two decades ago, elevating concerns surrounding market balance and potential instability.
Evaluating Housing Market Inflation Challenges
Nick Gerli, CEO of Re:venture Consulting, notes that inflation-adjusted home prices have soared to nearly twice their 130-year average. This unprecedented surge in real estate prices raises questions about the sustainability of the current housing market climate.
Unveiling the Truth Behind the Housing Market Price Surge
The Tale of Soaring Home Prices and Income Stagnation
Amid the cacophony surrounding the current housing market, Nick Gerli, CEO of Re:venture Consulting, dropped a bombshell. Gerli’s assertion that inflation-adjusted home prices have reached nearly double their 130-year average has sent shockwaves through the financial realm. Drawing parallels with historical episodes in 2006, he proclaimed that we are amidst the most substantial housing bubble in history.
Gerli’s comparison of home price appreciation to real income growth paints a bleak picture. Since 1970, real home prices have skyrocketed by 102%, while real incomes lag behind with a meager 26% increase. The stark imbalance between these two metrics reflects a precarious situation that, according to Gerli, is bound to collapse.
Unmasking the Illusion of a Bubble
While Gerli’s words ring alarm bells, a dissenting opinion emerges to challenge the prevailing narrative. Contrary to the bubble hypothesis, an alternate viewpoint argues that the recent surge in home prices is not a classic speculative bubble scenario. Rather, it is a consequence of the unprecedented infusion of liquidity into the market by governmental authorities.
The influx of freshly minted cash cascading into the housing sector postulates a different explanation for the price hike. The surge in the M2 Money Supply index, reflecting the total money circulation in the US, mirrors the trajectory of housing prices. This correlation suggests a direct link between the influx of government-generated capital and the housing market upswing.
Exploring the Unfolding Economic Landscape
Looking ahead, the proposition of an imminent “housing crash” appears less convincing in light of the prevalent economic scenario. With the injected money now integral to the economy, a complete collapse seems unlikely. The trajectory of home prices indicates a likelihood of stabilization at a higher baseline, paving the way for a new market norm.
However, the ongoing divergence between the affluent and the underprivileged segments amplifies the economic disparity. The surge in the number of 401(k) millionaires, propelled by the soaring stock market, accentuates this growing divide. While the elite prosper, financial burdens among the less fortunate escalate, signaling a socio-economic turbulence.
The Chasm Between ‘Haves’ and ‘Have Nots’
Highlighting the distressing disparity, the disparity between the ‘haves’ and ‘have nots’ manifests in striking clarity. The proliferation of million-dollar 401(k) accounts at Fidelity stands as a testament to the elite’s prosperity, contrasting starkly with the escalating financial challenges faced by the disadvantaged strata of society.
The Ebb and Flow of Economic Metrics: Unveiling New Records
Credit card debt has surged to unforeseen heights while the savings rate has plummeted to an all-time low, painting a stark picture of financial dynamics in the current landscape. This juxtaposition between borrowing and saving underscores a deeper narrative of diverging financial habits across the populace.
The Great Divide: 401(k) Millionaires Amidst a Bleak Retirement Horizon
Even as the number of 401(k) millionaires reaches unprecedented levels, the average American finds themselves ill-prepared for retirement. Data from Fidelity reveals that the average 401(k) balance has climbed to over $127,000, marking a 13% increase from the previous year. However, this growth contrasts sharply with the estimated $1.5 million that the typical U.S. worker believes is needed for a comfortable retirement, as indicated by a recent Northwestern Mutual survey.
A closer look exposes a glaring reality – only a minute fraction of individuals aged 55 or above have managed to amass $447,000 or more for their retirement nest egg, highlighting a significant savings gap. The looming retirement crisis is further exemplified by the skepticism expressed by half of the respondents in a recent study on Gen X’s retirement readiness, with many viewing a secure retirement as a distant, nearly miraculous achievement.
Renowned retirement expert Teresa Ghilarducci accentuates the divide between wealth tiers in retirement planning, emphasizing the discrepancy in retirement durations between those at different financial strata. As disparities in retirement preparedness continue to widen, the financial fabric of society stands at a crossroads.
The Stock Ownership Conundrum: An Imbalance in Equity Participation
Against a backdrop of soaring stock ownership rates nearing all-time peaks, a fundamental question arises – how feasible is it for individuals grappling with multiple jobs and financial hardships, akin to the portrayal in a poignant meme, to initiate stock investments in the current climate?
As the narrative unfolds, the sustainability of soaring stock prices in an environment where ownership percentages are escalating comes under scrutiny. The assumption of a flood of sidelined cash rushing into the market as a propellant for extended market growth warrants cautious consideration and contemplation.
Intriguing Indicators: Gold, Government Debt, and the Yield Curve Phenomenon
The financial landscape is textured with various compelling facets, such as the record-breaking acquisitions of gold by central banks, the proliferation of global government debt to unprecedented levels, and the accumulation of unrealized losses on bank balance sheets. Additionally, the flattening of the inverted yield curve today serves as a poignant signal of an impending recession, setting the stage for introspective analysis and strategic decision-making.
While the bullish momentum in the stock market prevails, a deeper examination uncovers burgeoning vulnerabilities seeping beneath the surface. Navigating this terrain requires a judicious evaluation of your stock portfolio, discerning between steadfast core holdings and more speculative assets necessitating stringent risk management strategies to safeguard wealth amidst prevailing uncertainties.
Arming yourself with a strategic approach entails reaffirming the rationale behind retaining your core investments and setting clear criteria for potential divestment of speculative ventures, which serves as a shield against abrupt market fluctuations and ensures a steady course through tumultuous waters.
Predicting the Unpredictable: Deciphering Seasonal Volatility
As the specter of September-induced market fluctuations looms large, the critical question emerges – how can investors distinguish between transient seasonal volatility and the harbinger of more profound economic upheaval?
Fortunately, the answer lies in maintaining a steadfast resolve towards core holdings while adhering to sound risk management protocols for speculative positions. By fortifying your financial defenses and fortitude, you pave the way for achieving investment objectives while bracing against the ripples of prevailing market instability.
As the investment landscape continues to evolve, proactive preparation stands as the cornerstone of navigating through uncertain economic currents and securing a stable financial future.
Wishing you a rewarding evening,
Jeff Remsburg


