Entering into September, the S&P 500 index continues its upward trajectory, maintaining resilience despite facing intermittent pullbacks. The ongoing bullish market trend, which originated in early 2023, has weathered recent corrections, including the one discussed in the previous month’s newsletter, which has since rebounded with vigor.
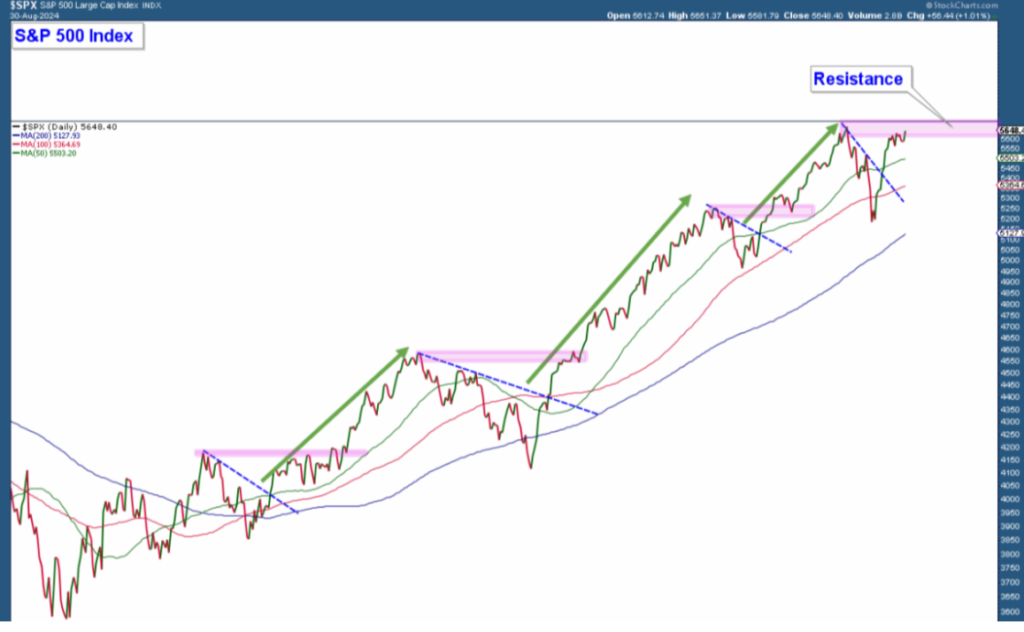
Highlighted in the chart below, the S&P 500 index has surpassed multiple resistance levels and crucial moving averages, signaling a robust surge beyond recent setbacks. This impressive climb suggests that the correction phase may have concluded, paving the way for continued upward movement, although the index currently encounters a pivotal resistance zone at its previous peak.

Beyond the S&P 500 index, various technical indicators reflect a strong bullish undertone in the market. The Invesco S&P 500 Equal Weight ETF (NYSE:), notably surpassing its pre-correction peak, signifies underlying market vitality. Additionally, there’s a notable shift from technology stocks towards value sectors like industrials, real estate, financials, utilities, and healthcare, a critical rotation characteristic of a robust bull run.
However, the performance of the is a cause for vigilance. Unlike the S&P 500, it continues to lag behind, failing to breach its prior peak and overcome its correction’s downward trend. While not a pressing issue presently, monitoring the tech sector’s performance, given its substantial influence within the S&P 500, remains crucial in the weeks ahead.
Equal Weighted S&P 500: Overcoming Resistance Levels
The recent breakthrough of the Equal Weighted S&P 500 index above its pre-correction high, as depicted below, marks a significant milestone. This upward progression past a key resistance point indicates a healthy market as it portrays broad market participation beyond just the major S&P 500 companies.

The index’s breakthrough reinforces the bullish narrative by showcasing momentum backed by a diverse array of stocks, not solely reliant on a select few heavyweights. This breadth in market participation signals a strong likelihood of the current uptrend persisting.
Sector Rotation: A Reflection of Market Strength
While the S&P 500 flirts with a critical resistance level, the robust performance across key sectors—industrials, real estate, financials, utilities, and healthcare—illustrated in the following chart sections, stands out. These sectors have all surpassed their respective pre-correction highs, solidifying the positive sector rotation trend mentioned earlier. This broad sectoral strength bolsters the optimistic forecast, indicating multiple market segments are contributing to the uptrend and bolstering the case for sustained growth.

Nasdaq 100: Trailing Amidst Market Recovery
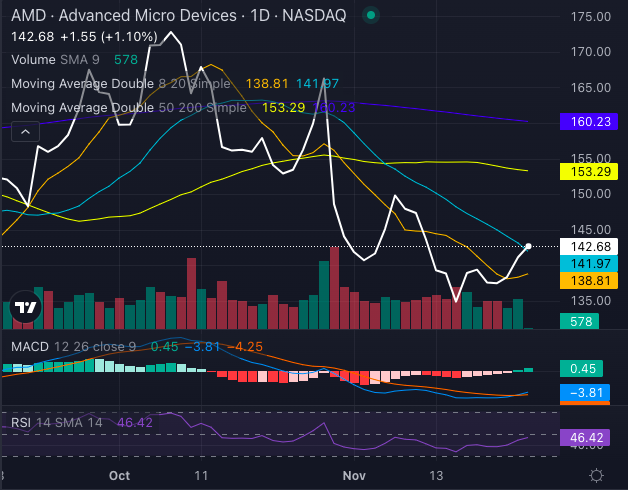
Contrasting with the broader market dynamics, the Nasdaq 100 ETF (QQQ) depicted in the final chart, remains below its downtrend line and pre-correction peak. Hovering near its 50-day moving average, this segment requires close monitoring as it presents a divergence in performance.
The underperformance of the Nasdaq 100 hints at the tech sector’s sluggish response within the S&P 500, raising concerns about its full participation in the market resurgence. Persisting weakness in this pivotal sector could impede the broader market’s ability to sustain its upward trajectory.

Wrapping Up: Market Outlook and Portfolio Adjustments
In essence, the prevailing uptrend in the stock market endures, with the S&P 500 exhibiting robust recovery post-correction and currently navigating critical resistance levels. The breakout of the Equal Weighted S&P 500 and the widespread sector rotation into value stocks reinforce the favorable market sentiment. However, the Nasdaq 100’s trailing performance, failing to breach key resistance points, warrants close observation.