Why Luke sees 30% gains … when will the bust come? … low- versus high-conviction stocks … Louis Navellier is taking a short-term trading approach
Enjoy the boom…but prepare for the bust.
That’s the quick and dirty roadmap from our technology expert Luke Lango:
We expect that stocks will boom in 2025 and likely into 2026 on the back of economic euphoria.
Then, something goes awry – maybe reinflation or too much lending; maybe the labor market cracks, or there’s too much AI investment and not enough payback – and the boom turns into a bust…
As such, we think the investment game plan for Trump 2.0 over the next 12 to 24 months is simple: Get fully bullish right now and stay that way for as long as the market keeps trending higher.
But be prepared to cash out and play defense as soon some things start to break (likely in mid-to-late 2026).
In making the case for a bull run under Trump, Luke begins by pointing toward two variables we highlighted last week
Pro-growth deregulation and increased corporate earnings.
With Trump in the White House and Republicans controlling both the Senate and the House, Trump should be able to remove significant regulatory headwinds and lower corporate taxes (the proposal is from 21% down to 15%).
This would be an enormous shot in the arm for corporate profits, and by extension, stock prices.
Here’s Luke quantifying this potential tailwind:
[Due to deregulation and pro-growth policies] from November 2016 (when Trump won his first term as president) to December 2017 (the end of his first year in office), we saw 2017 and ‘18 earnings estimates rise about 2% and 4%, respectively.
So, it seems Trump’s pro-growth policies were good enough for a considerable rise in earnings estimates during his last term in office. We think that’s achievable this time around, too.
Meanwhile, there is talk that Trump will also reduce the corporate tax rate from 21% to 15%. Goldman Sachs estimates that if he is successful at doing so, it could result in a 4% boost to earnings per share (EPS) for the S&P 500.
In other words, the boost to earnings over the next few years will likely be a 2% to 4% bump-up from pro-growth policies and a 4% bump-up from corporate tax cuts. Altogether, that’s a 6% to 8% increase in earnings estimates.
At the midpoint, that would take the current 2026 EPS estimate for the S&P 500 of ~$303 and make it $325 by the end of next year.
But this is just corporate earnings – what about a potential boost to investor sentiment?
The two factors that drive a stock’s price are: 1) earnings, and 2) how much investors are willing to pay for those earnings, which we think of as “investor sentiment.”
We just walked through the earnings component which Luke sees rising 6% – 8% under Trump. What about sentiment?
Back to Luke:
Throughout 2016 – before Trump took office for his first term – the S&P 500 was consistently trading between 16X and 18X forward earnings. That expanded during Trump’s first year in office, when the S&P consistently traded between 18X and 19X forward earnings.
In other words, likely due to increased confidence about the economy, investors pushed up valuations by ~10% the last time Trump was elected.
We think that’s doable this time around, too.
Throughout 2024, the S&P 500 has mostly bounced between trading at 20.5X and 22.5X forward earnings. And a 10% boost to that implies a ~23.5X forward earnings multiple for stocks.
When Luke combines these tailwinds, he gets a 2026 estimated EPS of $325 for the S&P 500 and a 23.5X forward earnings multiple.
This implies a 2025 target price of 7,640 for the S&P, which is almost 30% higher.
But every 1% gain gets us closer to the inevitable “bust” part of the cycle
It’s coming. It’s just a matter of when.
Back to Luke:
If earnings and valuations do rise in such a fashion, the market will have likely run into “bubble territory.”
That’s what we think is most likely to happen – a classic “Boom-Bust” cycle.
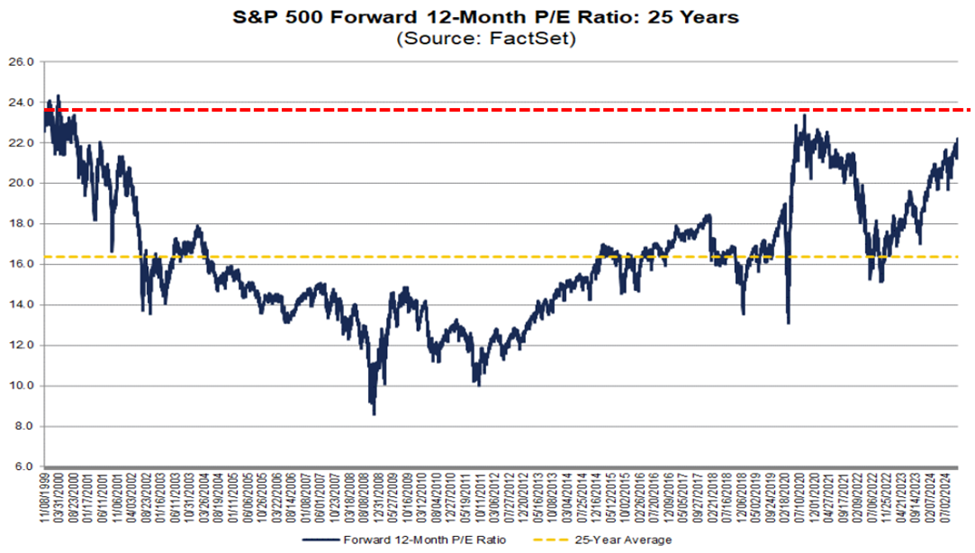
For some perspective on this potential bust, let’s look at Luke’s projected 23.5X forward earnings multiple.
Below is a chart from the data analytics group FactSet. It shows the forward 12-month earnings multiple in blue and the 25-year average in yellow. We’re looking at data going back to 1999.
I’ve added a dotted red line showing us where Luke’s 23.5 estimated multiple lies.
Note how this scenario would put the S&P at a valuation not seen since the top of the dot-com boom, just before its bust.

Source: FactSet
Now, though Luke believes we have another 1.5+ years of bullish conditions before the eventual bear, nothing is set in stone. There’s no guarantee that the bust won’t come sooner.
In his Innovation Investor Daily Notes, Luke points out that the S&P 500 is on track to rally more than 20% this year after rallying more than 20% last year. The only other times this has happened in the last 100 years were 1935/36, 1954/55, and 1995/96.
After each occasion, the market eventually busted but the timing varied. Here’s Luke with those details:
Immediately after the 1935/36 bull run, stocks crashed about 40% in 1937.
After the 1954/55 bull run, stocks fell flat in 1956 before crashing in 1957.
And after the 1995/96 bull run, we get another three great years in 1997, 1998, and 1999 – but that led to the huge Dot Com Crash wherein stocks fell about 50% from 2000 to 2002.
Though Luke’s research suggests we have a longer runway for gains this time around, no one truly knows. This is why I’ve been urging readers to take time to outline how they want to handle volatility whether it arrives in two years or two days.
The simplest way to do this is by categorizing your portfolio holdings into two groups…
Low-conviction and high-conviction.
Are you making a shorter-term trade where the goal is quick profits and outcome is less certain? Is your “buy” decision based on technical indicators that can change quickly? Is your planned hold period just a handful of weeks or months?
If so, you have low conviction. After all, whether you remain in that position is wholly dependent on its price and your indicators. If the trade turns south, your number-one goal will be the protection of your capital.
Compare this to a high-conviction holding…
For a company that you believe is a multi-year (or decade) hold, your conviction could mean that its valuation is irrelevant. You recognize that your stock will lose value in a bear market, but you’re fine with that.
Your plan is to ride the rollercoaster and let compounding and regular contributions during both high- and low-valuation periods snowball your wealth over time.
Right now, do you know which of your stocks fall into these two camps?
If not, you run the risk of making emotion-based decisions when volatility erupts. Countless studies reveal that such moves can have brutal financial consequences, potentially delaying retirement by years.
Find a few minutes this week to review your holdings through this low- and high-conviction lens. For every holding that you deem low conviction, decide what an appropriate stop-loss level will be.
This stop-loss should reflect the unique volatility of that specific stock, which helps prevent selling too soon or holding too long.
Meanwhile, for your high-conviction holdings, imagine seeing each one’s value drop by, say, 40%. Do the actual math based on your position’s market value, putting a dollar amount on your prospective loss.
Could you handle that haircut without selling in fear? If not, consider trimming the position to a “sleep at night” level.
Another action step is to balance your buy-and-hold portfolio with shorter-term swing trades over the coming months
Legendary investor Louis Navellier is taking this approach.
To be clear, Louis is still making long-term, buy-and-hold recommendations in some of his services. We’re incredibly early in megatrends such as AI, autonomous vehicles, and quantum computing, so select buy-and-holds stocks in those corners of the market are likely to reward investors many times over the coming years. Louis has his subscribers positioned for this.
But given today’s market environment – especially with Wall Street frantically recalibrating based on Trump 2.0 – Louis is complementing his long-term recommendations by zeroing in shorter-term opportunities.
The benefit is that this gives Louis exposure to surging bullish momentum but with less duration risk. Also, because it’s Louis, he’s relying on his quantitative stock grading system to guide him into and out of these positions. This means emotions and hunches play no role in the buy/sell timing – data decides all.
Louis’ short-term approach targets trades ranging from about one month to perhaps 10-12 months (as long as the strength remains) with the express goal of “cash in the pocket” returns. It’s not a buy-and-hold strategy, or one that relies on dividend reinvestment. It’s outsized returns, fast.
If you’d like to adopt such a shorter-term trade mindset in your own portfolio, you’ll find the Relative Strength Index (RSI) indicator and the Moving Average Convergence/Divergence (MACD) indicator are valuable. They’ll help you identify bullish and bearish reversals in your stock’s momentum, which can impact the profitability of your buy/sell timing.
If you’d like to learn more about Louis’ system and which specific shorter-term trades he’s taking today, click here.
Whatever market approach is right for you today, recognize that we’re somewhere in the late innings of this cycle
The good news is that history shows these late innings can produce some of the most spectacular market returns. The bad news is that when the eventual “game over” arrives, it usually takes investors by surprise, inflicting major portfolio damage.
Luke makes a compelling case for more gains to come. But in case “game over” arrives sooner than we all want, make sure you know what your plan will be. A few minutes of preparation today can avoid a tremendous amount of regret tomorrow.
Have a good evening,
Jeff Remsburg


