Market Volatility and the “V-shaped” Path
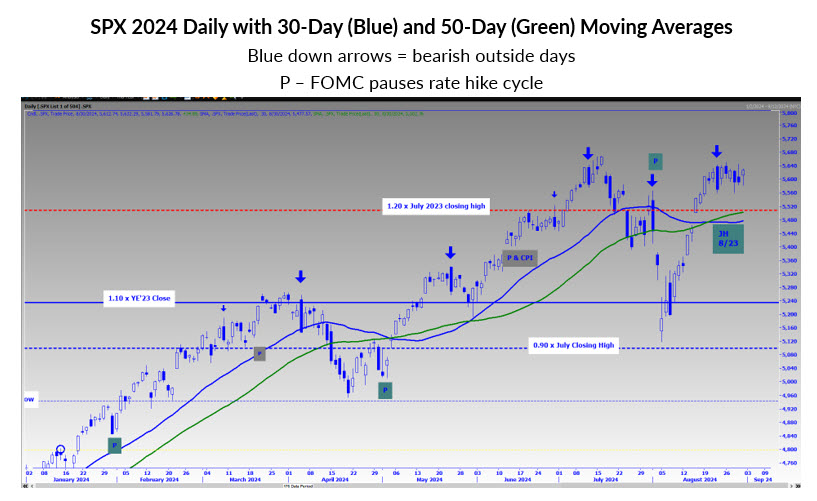
Throughout August, the S&P 500 Index (SPX–5,648.40) experienced a rollercoaster ride, reflecting a significant “V-shaped” pattern that saw a dramatic swing of approximately 1,050 points from its mid-July high to the low on August 5th, before rebounding to near its all-time closing high of 5,667 by the end of the month.
Support and Resistance Levels to Watch
As the SPX hovered around the 5,600 mark in the second half of August, it established key support and resistance levels. The range narrowed between 5,560 and 5,640, with the latter being a potential resistance level. Another hurdle to overcome is at 5,670, marking the mid-July all-time high.
Implications of Recent Events
Despite significant events such as Nvidia’s pivotal earnings report and Federal Reserve Chair Powell’s remarks on interest rate policy, the SPX remained range-bound. The market showed resilience, even in the face of these impactful developments.
Bearing the Bearish September Seasonality
As September approaches, historically a challenging month for bulls, investors brace for potential market downturns. Statistics show that September, particularly in non-presidential election years, tends to yield negative returns.
Technical Analysis and Market Outlook
Traders are closely monitoring the SPX’s movements, especially after a bearish outside day on August 22nd. The index teeters near its all-time high, showing signs of bullish momentum. However, with the market heavily shorted, there remains a lingering risk of pullbacks.
Buyback Programs and Market Stability
Companies with buyback programs may play a pivotal role in market stability post-earnings season. By potentially curbing pullbacks, these programs could influence market sentiment amidst ongoing volatility.


Looking ahead, investors are cautiously optimistic, closely watching market dynamics amidst macroeconomic uncertainties and technical indicators.


