Takeaways
• The easy money from positioning is fading as macro shorts and CTA demand peak, shifting the market into an earnings-driven “prove it” phase
• The rally remains narrow and mechanically driven, with megacap leadership and options flows masking weaker underlying breadth
• Volatility has reset lower, reopening both tail hedging and convex upside strategies across the S&P landscape
• Medium-term thematic trades are emerging beneath the surface, from fertilizer and grains to energy pass-through plays like airlines
• Market structure risks are building again, with potential dealer short gamma setting up a more volatile, reflexive tape on further upside
The Fuel Running Thin
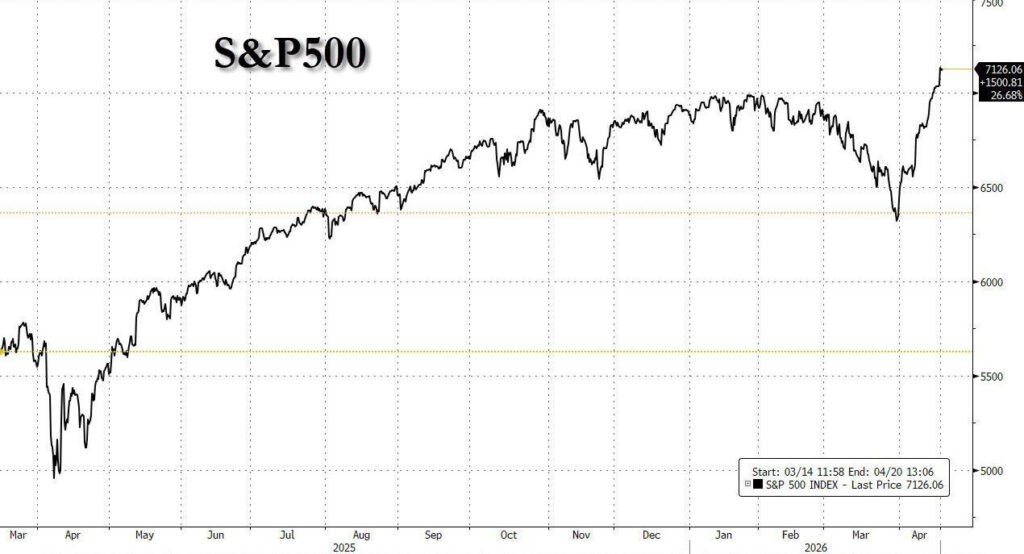
The market rang the bell on Friday as it had already read the final chapter. The sprinted another +1.2% to fresh highs north of 7,100, chasing a narrative that briefly felt neat, contained, almost too convenient. Oil didn’t just slip, it collapsed through the floor, down 12% to $83, while the 10-year yield eased back to 4.24% as if the inflation pulse had suddenly lost its urgency. All of it was built on a single headline that the Strait of Hormuz was “completely open” for business, a phrase that hit the tape like a green light in a market already leaning forward.
But the market has a habit of celebrating the rumour and interrogating the fine print later. That “open” turned out to be conditional, tied to the unwinding of blockades that neither side appears willing to concede. President Donald Trump made it clear the US stance is unchanged, and by the time Sunday night trading flickered back to life, the optimism had already begun to leak out of the system. What looked like a clean reopening now feels more like a corridor still lined with tripwires.
And yet, the hope trade refuses to fully leave the room. Talks between Washington and Tehran are now expected in Islamabad later this week, a rescheduled diplomatic dance after earlier timing proved more fiction than fact. There are whispers of a larger bargain taking shape, with the US potentially weighing the release of $20 billion in frozen Iranian funds in exchange for Tehran stepping away from its enriched uranium stockpile. It is a big lever, the kind that could reset the board if pulled, but for now it sits in the realm of possibility rather than policy.
The problem for markets is not the absence of hope; it is the overpricing of it. The latest move higher in equities has started to feel less like conviction and more like momentum feeding on itself. The tape is stretching, the narrative is thinning, and skepticism is beginning to seep back into the edges. The market is still trading the destination, but the journey has just reminded everyone it is far from linear.
Even Goldman Sachs desks that usually ride the momentum are starting to sound a touch uneasy. John Flood put it plainly over the weekend, telling clients it is “starting to feel like a bit much,” and when pressed on why the market keeps rallying, the answer cut straight through the macro noise and into the engine room.
Gross leverage is still elevated while net exposure remains light.
That is the tell.
It leaves the market structurally offside, underinvested in the very move it is being forced to chase. Every push higher becomes less about fresh conviction and more about forced participation, a mechanical squeeze where positioning, not fundamentals, dictates the tempo. This is the right tail scenario we flagged back in late March, now unfolding in real time, with Friday delivering the kind of velocity that only shows up when the street is leaning the wrong way and gets caught reaching.
What looks like a clean rally on the surface is really a pressure build underneath, a market not climbing on belief but being lifted by its own imbalance.Flood’s conclusion: “the market is now properly primed for a pull back next week:”
Still, looking purely at technicals, Flood concedes that this rally could keep going for a bit longer – until we see net positions tick higher (i.e.,> 50th percentile on both the 1-year and 5-year lookbacks). Goldman’s PB data currently shows Overall book Gross Leverage at 310% (92nd percentile 1-year, 98th percentile 5-year) and Net Leverage @ 75% (21st percentile 1-year, 51st percentile 5-year).
Under the surface, the rally is not broadening; it is concentrating, and the fingerprints of positioning are all over it. Brian Garrett ( another Goldman desk hand) laid it out in a late Sunday note, pointing to the quiet engine behind the month-to-date surge in tech and the so-called Magnificent 7.
For every dollar of short SPDR S&P 500® ETF Trust (NYSE:) or that has been covered, and there has been a lot of it, roughly 37 cents has been funnelled straight into the market’s “generals.” Not the rank and file, not the equal weight broad tape, but the names that carry the index on their shoulders.
That flow dynamic matters.
It explains why the rally feels powerful at the headline level while still oddly narrow beneath the surface. Megacap leadership has surged ahead of the by 1330 basis points over just three weeks, a spread that sits in the far tail of history. This is not organic breadth expanding; it is capital being mechanically redirected into the biggest boats in the harbour.
The result is a market that looks strong but trades top-heavy, where passive flows and short covering combine to amplify the same names again and again. The generals are being bid not because the battlefield has changed, but because positioning demands it.

At the same time, the options tape is starting to hum in a way that feels less like hedging and more like outright chase. Call volumes in the megacap complex are exploding higher, adding another layer of fuel to an already imbalanced setup.
This is where the loop tightens.
Short covering drives flows into the generals, those flows lift prices, rising prices pull in call buyers, and the dealers on the other side are forced to hedge by buying more of the same underlying names. It is reflexive, self reinforcing, and increasingly detached from any fundamental anchor.
The result is a market where the biggest names are no longer just leading; they are being mechanically levitated. What started as positioning unwind is now bleeding into options-driven acceleration, turning a narrow rally into a feedback machine where momentum feeds on itself, and volatility gets quietly suppressed on the way up.
It is not just a rally anymore. It is a squeeze wrapped inside a gamma loop, and those tend to run harder and longer than most expect, right up until they don’t.
The flow is evolving, but it is not cooling; it is rotating. Flood’s desk is seeing hedge funds step out of their macro hedges and lean back into single-name risk, shifting from defence to selective offence. The short-covering phase is giving way to outright accumulation, with capital now being redeployed into areas the market still believes have another gear.
That belief remains firmly anchored in the AI complex. The conversation is less about whether the theme works and more about where the next layer of torque sits. Energy infrastructure, industrial build out, and hardware suppliers are drawing the flows, the picks and shovels behind the narrative rather than just the narrative itself. Outside that orbit, healthcare is quietly picking up sponsorship, a reminder that even in a concentrated tape, capital still looks for diversification at the margins. Software, which had been left behind, is seeing a wave of coverage and quiet re-entry, while long-only money continues to act as the passive bid underneath the market, heavily skewed toward the same supercap names that have been carrying the tape.
Fundamentals, at least for now, are not getting in the way. Earnings season has opened on a firm footing, and with roughly a quarter of the S&P 500 market cap set to report in the coming week, the tape is about to get a much clearer read on whether the narrative can keep outrunning reality. The capital markets backdrop is also supportive, with fresh IPO supply being absorbed cleanly and merger activity continuing to hum, both signs of a market that is still willing to underwrite risk.
Underneath it all, the plumbing looks healthier. ETF participation has slipped back toward more normal levels around 30% of the tape after running hot through March, and liquidity has improved meaningfully, with top of book depth in the S&P rebuilding from stressed levels. The market feels less fragile than it did just weeks ago, with more depth to absorb flow.
But the character of the bid is starting to change. The CTAs that helped ignite the April surge are now firmly long and still adding, but the pace is slowing. After deploying tens of billions into equities, they remain buyers, yet the marginal impulse is fading. As Flood flags, the highest velocity demand from that cohort is now behind us.
That matters.
The market is transitioning from forced buying to discretionary belief. The squeeze phase is giving way to a conviction phase, and those tend to trade very differently. The fuel is still there, but it is no longer being poured on at the same rate, leaving the tape more dependent on earnings delivery and sustained narrative rather than pure positioning mechanics.


And Garrett is on the same page, flagging that the easy part of the rally is now behind us. The technical tailwinds that powered the move, the heavy macro short covering and the relentless CTA demand are beginning to fade, handing the baton back to fundamentals. The next two weeks are no longer about positioning; they are a “show me” moment for earnings.
That is where the tone shifts.
Because of all the structure that has lifted this market, direction here is anything but clean. The tape is being hit with a constant barrage of headlines, many of them coming straight from Truth Social via Donald Trump, where the incentive to keep the market buoyant is hardly subtle. The result is a market that is trading in bursts of narrative rather than a steady flow of conviction, reacting as much to tone as to data.
Garrett’s comparison lands for a reason. This has the feel of April 2025 all over again, that same post-liberation day dislocation where flows, headlines, and positioning collided into something that looked directional on the surface but felt unstable underneath.
This remains a very hard tape.
Not because there is no trend, but because the drivers of that trend are shifting in real time. The market is moving from mechanically supported to fundamentally tested, all while navigating a headline cycle that can flip sentiment in a heartbeat. In that kind of environment, clarity is scarce, and conviction comes at a premium.
Hard or not, the Goldman trader shares his top 5 trades below:
There are still pockets of the market where the crowd has not fully planted its flag, and that is where things start to get interesting. Emerging market equities are creeping back onto the radar, not with fanfare but with the kind of valuation mismatch that makes seasoned desks stop and look twice. Tony Pasquariello’s Korea line captures it perfectly: what if you could buy a market where consensus is looking for +200% earnings growth and the forward multiple still sits at just 7x. That is not a stock story. That is a market trading like no one believes the story yet. In the US, iShares MSCI South Korea ETF (NYSE:) is the clean weapon of choice, though the trade runs deeper than one ticker. And then there is China tech, where KraneShares CSI China Internet ETF (NYSE:) saw 400,000 calls trade on Friday, a reminder that when appetite starts coming back to battered growth proxies, it rarely knocks politely before entering.
At the same time, the collapse in equity volatility is quietly reopening a door that was shut only days ago. Tail hedges are tradable again. Goldman’s desk was printing S&P 500 Index lookback puts this week, and that tells you something important about the new shape of the board. The cost of 3 month 95% lookback protection is now lower than it was pre-conflict, and only marginally above the 5-year average cost of a 95% vanilla put. In other words, the market has cheapened insurance just as the headline fog remains thick. That is the kind of setup traders wait for. When the tape starts acting calm while the macro backdrop is still one bad headline away from a lurch, owning the tail stops looking defensive and starts looking smart.
Upside vol in the S&P 500 Index has now been compressed to the point where optionality is no longer a luxury; it is a tool you can actually afford to use again.
That changes the playbook.
If you are running a bearish view and carrying a heavy short delta, you can now layer in upside vol as protection without it bleeding you dry. You are no longer forced to choose between being right on direction and wrong on convexity. The cost of insurance has come in at a level that lets you defend the tail without killing the trade.
On the flip side, if you are leaning bullish, the right tail is back on the menu. You can own convex upside outright rather than chasing spot into strength, positioning for an extension without paying peak-panic pricing for that exposure.
In other words, the vol reset has reopened both sides of the expression spectrum. Direction still matters, but now you can shape it with convexity again. That is when the tape gets more interesting, because it is no longer just about where the market goes, but how you choose to get paid when it does.

A quick but important sidenote from the Goldman playbook: their models show dealers flipping meaningfully short gamma in the S&P 500 Index if spot squeezes another 2% to 3% from here.
That is where the tone of the tape can change fast.
Up to now, the rally has been supported by positioning unwind and systematic demand. But push the index a little higher, and the market structure itself starts to shift. When dealers are short gamma, they are no longer dampening moves; they are amplifying them. Strength forces them to buy into strength, weakness forces them to sell into weakness.
That is the setup for a spot-up, vol-up regime.
In practical terms, it means a grind higher can quickly morph into something more violent, with momentum feeding on itself and intraday ranges stretching. The same mechanics that suppressed volatility on the way up can flip and instead accelerate it.
It is the kind of inflection point traders watch closely. Another 2% to 3% higher does not just extend the rally; it risks changing the character of it entirely, from controlled squeeze to something far more reflexive and unstable.
Another way to play this tape is to lean directly into the squeeze mechanics, but do it intelligently on pricing. Goldman’s flagship short-squeeze basket, GSXUMSAL, is a clean proxy for where positioning remains vulnerable.
The key here is dispersion in vol.
At the single-name level, 3-month 10% out-of-the-money calls across the basket are running at roughly 85 vol on a weighted basis. That is expensive, and it reflects exactly what you would expect, crowded shorts already paying up for protection or upside optionality.
But step back to the basket level and the math shifts.
The option on the index itself is trading 25 to 30 vols cheaper than the weighted average of its components. That is a meaningful discount, and it gives you a far more efficient way to express the same view. Instead of picking individual names and overpaying for convexity, you are buying the systemic squeeze risk at a relative bargain.
In this kind of market, where positioning imbalances are doing much of the heavy lifting, that distinction matters. You are not trying to guess which short blows up first, you are positioning for the idea that enough of them do at the same time.
It is a cleaner expression of the same trade, with better pricing and less single-name risk, and in a tape like this, that is often where the edge sits.
Further out along the curve, the market is starting to price something more subtle than the immediate headline shock. The Middle East disruption is not just an oil story; it is a supply chain story, and those tend to echo with a lag. Fertilizer sits right in that transmission channel. Disrupt the flow today, and you are effectively repricing next season’s crop input costs, which feed directly into the grain complex 6 months down the line.
That is where the opportunity starts to take shape.
Goldman has been leaning into this by lifting call structures on the Bloomberg Commodity Grains Index at around 22 implied vol, a relatively contained price for something that could see a second wave of repricing once the physical constraints start to bite. It is not a front-page trade yet, but that is often the point. These are the themes that move quietly before they move materially.
And this is what Brian Garrett is getting at with “medium term impacted” trades. The first-order effects grab the headlines: oil, shipping lanes, and immediate risk premium. The second-order effects are where positioning can still be built with some edge. Airlines facing higher jet fuel costs is another clean example, a margin story that does not hit all at once but builds as the input pressure works its way through.
In a market dominated by crowded themes and reflexive flows, these slower-burning trades offer something different. They are less about chasing the current tape and more about positioning for what the tape has not fully priced yet. That is where differentiation comes from, and in this environment, that is increasingly where the opportunity sits.
5 Stocks Our Experts Predict Could Double In the Next Year
By submitting your email, you'll also get a free pivot & flow membership. A free daily market overview. You can unsubscribe at any time.